2.3 Statistics for Two Categorical Variables
3 min read•june 18, 2024
Avanish Gupta
Avanish Gupta
AP Statistics 📊
265 resourcesSee Units
Additional Relative Frequencies
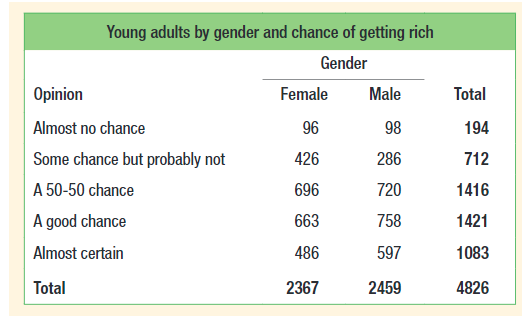
Lets look back at the two-way table from Unit 2.2.

Courtesy of Starnes, Daren S. and Tabor, Josh. The Practice of Statistics—For the AP Exam, 5th Edition. Cengage Publishing.
We can find more than just joint relative frequencies here as there’s also marginal relative frequencies and conditional relative frequencies. 😲
Marginal Relative Frequency
A marginal relative frequency is the relative frequency of all the people in a certain category. For example, the marginal relative frequency of a "50-50 chance” is 1416/4826 as from the right margin, we see that 1416 overall respondents gave that response. In other words, the marginal relative frequencies are the row and column totals in a two-way table divided by the total for the entire table. ➕
Conditional Relative Frequency
On the other hand, the conditional relative frequency is the frequency that we have of a particular category given the fact that we know a subject is in another category. The category that we know is called the given, or independent category, while the other is called the dependent category, just like independent and dependent variables on graphs.
For example, the conditional frequency for “50-50 chance given male” is 720/2459 because out of the 2459 males who responded, 720 of them said “50-50 chance.” When calculating a conditional relative frequency, our denominator (or total) is usually considerably smaller than that of overall total. 🧱
Determining Associations from a Two-Way Table
From a two-way table, we can use marginal and conditional relative frequencies to consider if two categorical variables are associated or not. To do this, see if two corresponding conditional relative frequencies across different categories are not the same. This is also the same as seeing if the conditional relative frequency is not the same as the marginal relative frequency for the dependent category. This makes it so that certain independent category values are more likely to yield a certain result than others. That is, we can predict behavior given the fact that we know that an individual falls under a certain category. 💍
Example
Using the two-way table above, we can determine that the variables "gender" and "opinion" are independent, or not associated, because the marginal relative frequency of being "50-50 chance" is roughly equal to the conditional relative frequency of being "50-50 chance given male".

🎥Watch: AP Stats - Probability: Two Way Tables, Independence, Tree Diagrams, etc
Vocabulary Practice from 2.1 to 2.3 Material
Match the number with the letter that corresponds to its description! 😁
1. Two-way tables
2, Side-by-side bar graphs
3. Mosaic plots
4. Segmented bar graphs
5. Categorical variable
6. Quantitative variable
7. Bivariate variable
8. Marginal relative frequency
9. Conditional relative frequency
A. A graphical display that shows the relationship between two categorical variables by dividing the area of a rectangle into tiles that represent the different categories of both variables.
B. A graphical display that shows the distribution of a categorical variable by displaying the frequency or relative frequency of each category as a bar.
C. A graphical display that shows the relationship between two categorical variables by dividing the bars in a bar graph into segments that represent the different categories of one of the variables.
D. A statistical table that shows the frequencies or relative frequencies of two categorical variables in a cross-tabulated format, with one variable represented by rows and the other by columns.
E. A variable that can take on a limited number of categories or values, such as "male" or "female," but cannot be meaningfully ordered or measured on a continuous scale.
F. A variable that can be measured or ordered on a continuous scale, such as height or weight.
G. The relative frequency of a particular category of a categorical variable within another category, calculated by dividing the frequency or relative frequency of the first category within the second category by the total frequency or relative frequency of the second category.
H. The frequency or relative frequency of a particular category of a categorical variable, calculated by dividing the frequency or relative frequency of that category by the total frequency or relative frequency for the entire sample or population.
I. A statistical concept that refers to the relationship between two variables, often used to describe the association between two categorical variables.
Answers
1. D
2. B
3. A
4. C
5. E
6. F
7. I
8. H
9. G
Browse Study Guides By Unit
👆Unit 1 – Exploring One-Variable Data
✌️Unit 2 – Exploring Two-Variable Data
🔎Unit 3 – Collecting Data
🎲Unit 4 – Probability, Random Variables, & Probability Distributions
📊Unit 5 – Sampling Distributions
⚖️Unit 6 – Proportions
😼Unit 7 – Means
✳️Unit 8 – Chi-Squares
📈Unit 9 – Slopes
✏️Frequently Asked Questions
📚Study Tools
🤔Exam Skills

© 2024 Fiveable Inc. All rights reserved.