1.3 Estimating Limit Values from Graphs
2 min read•june 18, 2024
AP Calculus AB/BC ♾️
279 resourcesSee Units
🎥Watch: AP Calculus AB/BC - Graphical Limits
This topic centers around the difference between the value a function is approaching (limits) and the value of the function itself. Graphs are a great way to help visualize the difference between these two concepts.

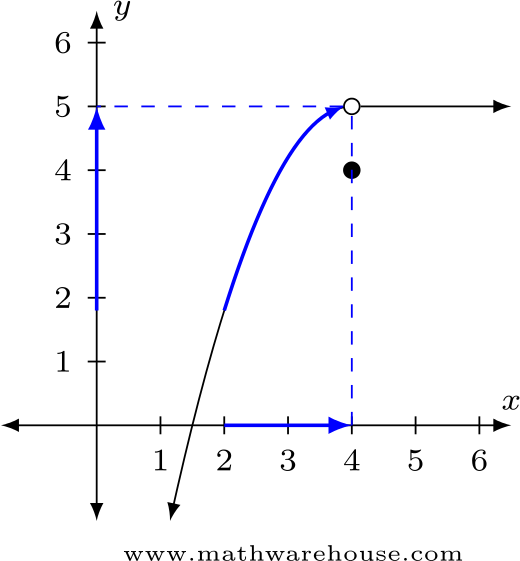
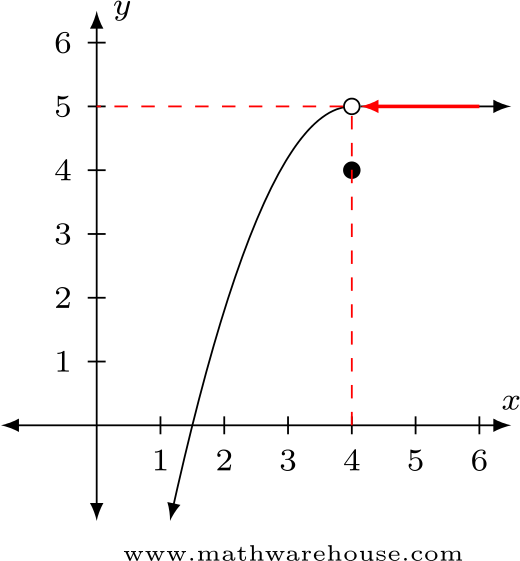
In the graph above, we can show the difference between the value a function is approaching and the actual value of the function. Starting on the left side of the function and moving toward x = 4, we can see that the y value gets closer to y = 5. Starting on the right side and moving backward to x = 4, we also get closer to y = 5. However, if we try to evaluate the function AT x = 4 we get y = 4. This is the key difference between the value a function is approaching and the value of the function itself. In this example, the limit is 5 but the value of f(4) is 4. 🤓
The big takeaway from this example is that the value of a function at a particular value does not (✖) mean that the limit value is the same.
Estimating a Limit Value: Step by Step
As you saw in the example above, we estimate a limit value in a graph by approaching the x value from both sides. Here are the steps needed to estimate the limit value:
- First, we approach the x value from the left side.
- After getting a y value from the left side, approach the x value from the right side.
- If the y values from the left side and the right side are the same, we say that the limit is that y value. If the values aren’t equal, we say that the limit does not exist.
If you’re still confused, take a look at the pictures below. 📷


Browse Study Guides By Unit
👑Unit 1 – Limits & Continuity
🤓Unit 2 – Fundamentals of Differentiation
🤙🏽Unit 3 – Composite, Implicit, & Inverse Functions
👀Unit 4 – Contextual Applications of Differentiation
✨Unit 5 – Analytical Applications of Differentiation
🔥Unit 6 – Integration & Accumulation of Change
💎Unit 7 – Differential Equations
🐶Unit 8 – Applications of Integration
🦖Unit 9 – Parametric Equations, Polar Coordinates, & Vector-Valued Functions (BC Only)
♾Unit 10 – Infinite Sequences & Series (BC Only)
📚Study Tools
🤔Exam Skills

© 2024 Fiveable Inc. All rights reserved.